
It’s finally started! On Thursday 22nd September 2022 I started the data collection phase for my main doctoral study. Since then, I have conducted a focus group (which will take far longer to analyse in any useful detail), but in this post I’ll outline some of the headline findings from the first of three psychometric tests conducted with Year 11. You can read more about the plan for my whole study here.
In a nutshell, the SRQ-A is a questionnaire that consists of 20 statements, and students are required to rank their level of agreement (scale 1-5, where 1 is ‘completely disagree’ or ‘entirely unimportant’, and 5 is the opposite). For my study, I added five additional statements that all relate to the use of target grades, where each statement aligns with one of the four motivation types (or amotivation). Whilst the statements I’ve designed have not been previously validated through a published study, pilot studies confirmed pupils’ understanding of the statements, and the language used to design them were in line with the language used in the previously-validated statements from the SRQ-A.
What have I looked for in this data?
- What motivation type each student most identifies with, and what proportion of the population experiences each one
- Relative Autonomy Index
- Correlation (or lack of) between motivation and previous attainment
- Target Grade Affinity Index
Motivation types
Firstly, I’ve determined the proportion of the year group that, at this point in time, most associates with each motivation type.
- Entirely unmotivated: 11% (hopefully self-explanatory what this means…)
- Externally motivated: 38% (students are primarily motivated by external sources, and experienced entirely controlled motivation, for example sanctions for incomplete work)
- Introjected motivation: 25% (the person acknowledges there is some form of ‘motivating’ regulation, but has not accepted this motivator as their own)
- Identified motivation: 48% (this person can identify congruence with their own motivation, and the regulation experienced from external sources; they recognise why studying is important)
- Intrinsic motivation: 10% (this student experiences entirely autonomous motivation, and is motivated primarily by their enjoyment of, and interest in, learning).
The first point to note here is that clearly the percentages do not add up to 100%. This is since some students gave responses that give more than one motivation type. In these cases, I have recorded that they associate with both types.
Whilst most of the results are unsurprising, the large portion of students that experience internalised motivation was unexpected. It would be worth noting that over 25% of this group of students also identified with another motivation type. The result that indicates that almost half of all pupils can recognise that studying is important is reassuring. However, the stark contrast with the proportion of students who actually enjoy studying, at only 10%, is perhaps less reassuring.
Relative Autonomy Index (RAI)
This measure is established (see Howard et al. (2020) for more details), and identifies the extent to which students experience autonomous motivation by using a weighted mean of all of their responses to all of the motivation types (not including amotivation).
The histogram below shows the portion of students (n=205) that have RAIs in the given ranges. As the graph shows, the majority of students (67%) experience a negative RAI, and consider their motivation to be mostly controlled. Only 30% had positive RAI scores (and the remaining 3% with exactly RAI=0).
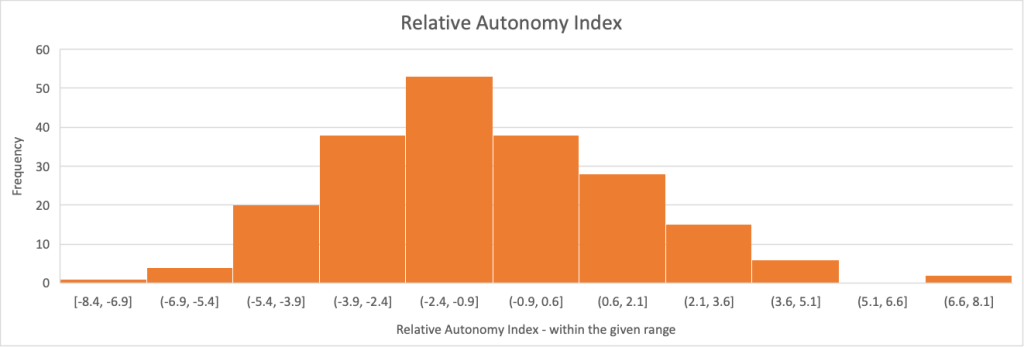
We can take from this data that, in general, students do not feel a significant sense of autonomy in their studying. The focus group conducted since the SRQ-A data started to give more context to this, however I’ll save that for another post.
Correlation of RAI and previous attainment
To try and determine if there as a correlation between autonomous motivation and previous attainment, I compared the RAI scores from each pupil (n=205) with their previous attainment. Usually this is conducted through ‘Attainment 8’, which is the sum of the grades of the student’s top eight subjects. In this example however, I have used ‘Attainment 10’, using their top ten subjects instead.
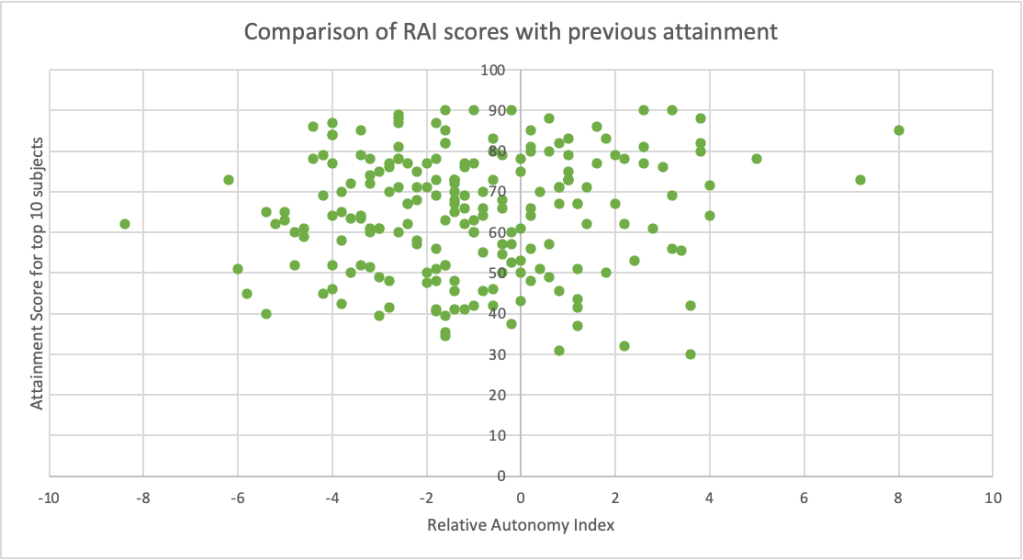
Despite the fact I didn’t include a line of best fit, it is clear that there is no clear correlation between the type of motivation students experience, and their previous attainment. Whilst this lack of correlation doesn’t lead to any concrete conclusions, what it does tell us is that autonomous motivation is possible for students regardless of their prior attainment (and therefore likely ‘ability’, though we could debate what is meant by ‘ability’). Additionally, the density of data points on the left-hand side of the y-axis (i.e. with negative RAI values) is much higher than those with positive values, supporting the generally controlled motivation types detailed in the last section.
Target Grade Affinity Index (TGAI)
Using the formula from Howard et al. (2020) for RAI, I have designed a new formula to calculate the extent to which students feel that they are intrinsically motivated specifically by their target grades.
At the moment, I have calculated this in two ways (and I’m not yet sure of which of these formulae will ‘stick’). One formula ignores the ‘amotivation’ factor students were asked about when considering target grades, producing a statistic that is more comparable with the relative autonomy index. However, since the amotivation statement relating to target grades asks students if they see target grades as pointless, I decided to include this in a separate calculation.
In order to be sure that the two calculations were roughly consistent, I calculated a Pearson rank correlation coefficient, resulting in 0.489 (a medium positive correlation, when considering the 205 data points included). I made a graph of these and it produced a very interesting pattern!
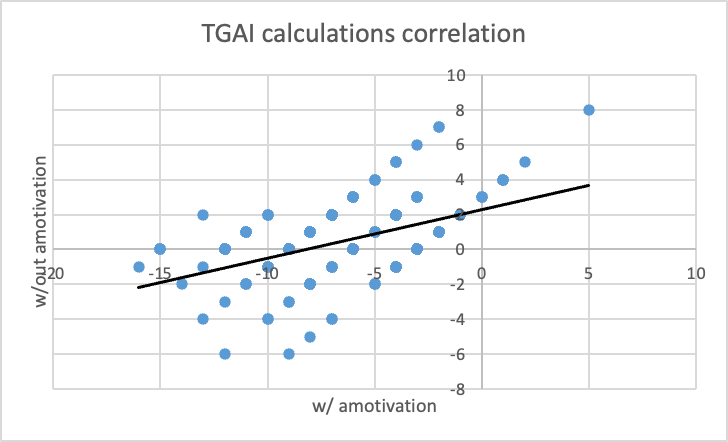
Whilst I initially was surprised by the pattern, it is logical given that the formula for ‘with amotivation’ includes all the same data as for the ‘without’, but with the addition of -3 * amotivation score. This means that every point will be on a line with the formula y = x + 3n, where n = amotivation score.
If I stick with the ‘without amotivation’ method of calculating TGAI, it’s possible to see that most students are slightly unmotivated by their target grades.
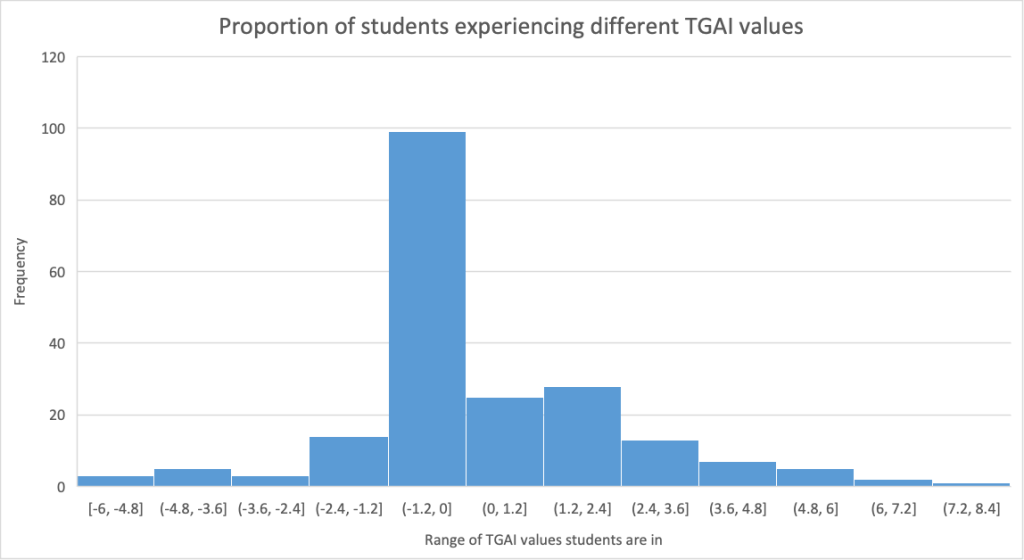
The graph highlights the large portion of students with negative TGAI values. However, there is a second (much smaller) peak at TGAI=(1.2, 2.4], indicating that some pupils feel they need to meet (if not exceed) their target grades.
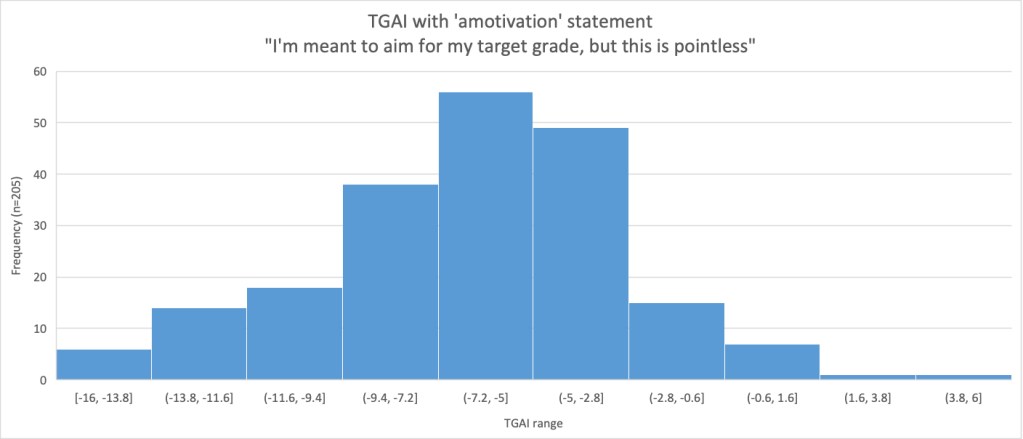
Whilst the graph above does not include the ‘amotivation’ score, its inclusion did significantly affect the TGAI values (as can be seen from the first TGAI correlation graph above). This next graph details the number of students whose TGAI was brought down significantly by the indication that students view target grades as pointless.
What’s working well so far?
I think the use of a specific measure for affinity to target grades is going to help significantly with the first research question about whether students find target grades motivational.
There is probably a lot more I could find from this data, but I’ll leave it as it is for now.
What is not working so well at the moment?
The RAI uses a formula that includes the four types of motivation, but does not consider amotivation in its calculation. In order to produce a comparable value between TGAI and RAI, I think it is more appropriate to include the measure without amotivation entirely for comparison.
Brief conclusions so far (TL;DR)
- It appears so far as though students don’t like target grades, however this will be clearer once analysis in conjunction with focus groups has happened.
- Students don’t feel a significant degree of autonomy in their studies, and the use of targets doesn’t seem to help this.
- I need to decide how to calculate TGAI…!
- Intrinsic motivation has basically no correlation with prior attainment; any student can feel motivated regardless of their ‘ability’
What’s next?
Having conducted the first focus group (using some of this data to do so), I have started transcribing and will begin analysis of that soon.
Following that, I will conduct the questionnaire twice more with Y11, along with an additional focus group. Research with Y10 is yet to start, but will do next month (November 2022).
I plan to keep updating with snippets of findings as I go!

Leave a comment