
In this post, I will outline the findings from my study. It’s a bit longer of a post since there’s a lot of data! The quantitative findings come first, addressing the Relative Autonomy Index and Target Grade Affinity Index, and their relationship. Then the qualitative findings focus on the key findings relating to students’ perspectives on target grade use and alternative methods of motivation they use. I haven’t outlined the triangulation here, but that will come in a subsequent post.
You’ll be unsurprised to know this is by far not all the data generated, but a helpful snapshot of what I found. There is a ‘key takeaways’ section at the bottom if you need a TL;DR.
Quantitative findings
The quantitative method I used (the psychometric test known as the SRQ-A) returned some pretty helpful data. Of course, it wasn’t helpful until post-analysis, and I can write a bit more about that if it seems there is some interest. A summary of the quantitative findings:
- When measuring students’ Relative Autonomy Index (RAI), these were consistently close to 0, and consistently negative. This, in short, indicates that students largely aligned more so with controlled motivation types (think: introjection and external regulation).
- The RAI values ranged on a scale with several students at the extreme ends (very autonomous motivation vs very controlled motivation), and this lined up with almost 50% of students consistently identifying with either external or introjected motivation.
- As I have mentioned previously, I added five new items to the SRQ-A’s established 20-item questionnaire. These new items used the same language as the established items, but were related explicitly to target grade use. I used these items to calculate a student’s Target Grade Affinity Index (TGAI), returning a range of data on a similar scale to the RAI.
- The TGAI values, like RAI, were consistently close to 0, however they were also consistently just above 0. While this indicates an overall ambivalence toward target grade use, there is mild positivity compared to students’ overall academic motivation.
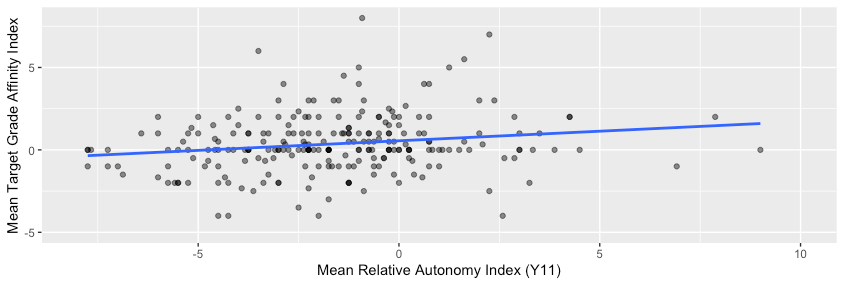
- There was a weak but statistically significant dependence of TGAI on RAI. A linear regression (for each year group) showed this:
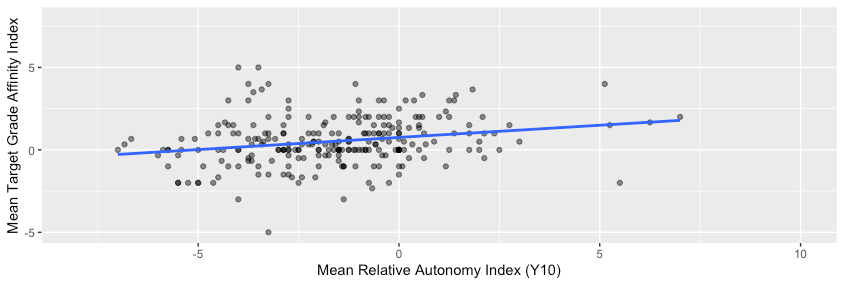
- For year 10:
…
- …and for year 11:

Additionally, there was found to be no statistically significant relationship between students’ TGAI values and their actual mean target grades, nor between their RAI values and their actual mean target grades.
If we assume that students’ mean target grades are a reflection of their academic ‘potential’ or ‘ability’ (despite this assumption being riddled with issues), one could conclude that students’ actual ability has no bearing on their academic motivation, due to target grades or otherwise.
Qualitative findings
I did produce a couple of posts when initially analysing the data relating to autonomy here, and relating to students’ perceptions of competence here. This section summarises the findings relating to students’ perceptions of target grade use specifically, though relates to those other posts too.
Target grade use
There were a few comments from students throughout the focus groups that indicated target grades can be helpful as a minimum benchmark to meet or exceed. If students take the view that ‘I need to beat this low target’, that is a form of (extrinsic, introjected) motivation. Additionally, two students indicated that they found the pressure that stems from target grade use to be helpful for their motivation.
There were numerous statements, however, indicating a dislike for target grades on the whole. These included:
- The data used to generate the target grades is too old to be reasonable
- The target grades are too high & unattainable
- The target grades are too low & this is demoralising
There were a few concerning statements that indicated that students were sanctioned for missing target grades, or sometimes they were asked to re-sit assessments in an attempt to improve their grade. In some cases, the students were asked to re-sit assessments without receiving any feedback or guidance on how to improve their grade; this is a problem.
The students also outlined several measures they found more helpful for their motivation than target grades and the way their teachers used the target grades, outlined below.
Alternative motivators
Predicted grades, i.e. the predictions for the grade a student will achieve in their GCSE exams based on recent assessment data & a teacher’s knowledge of the student, was suggested as a more reliable metric for students to identify their academic progress.
Additionally, some students found aiming simply for improving on their last grade more helpful than target grades (or predicted grades). This seemed like a more achievable way to achieve improved grades compared to simply aiming for arbitrary benchmarks.
Finally, the most interesting of the alternative benchmarks, was entry requirements to courses of further study. This usually meant the minimum grades required to join a specific A-level course, though this could also be related to university aspirations or goals for a specific career.
Key takeaways
- Students more likely to be motivated by their target grades were usually more academically motivated anyway.
- Target grade affinity was unrelated to the actual target grades.
- The experiences students had relating to how their teachers used target grades were often negative, though the way teachers framed this was essential. Positive framing with encouragement was helpful; sanctions and re-sits because ‘this isn’t good enough’, less helpful.
- Students found referring to their predicted grades, or focusing on continual improvement, more helpful for their motivation (and outcomes?) than referring to their target grades.
- There was an awareness of the impact GCSE exams could have on students’ futures and their aspirations, and this factored into their motivation to work toward exam success.
A subsequent post will cover the triangulation of these data, and the theorisation and conclusions I’ve drawn from it. Tune in next time…

Leave a comment