
Since my post in August where I described my long-term aim to move into working with data full-time, I’ve been working relatively hard to ‘upskill’ myself so that I could actually do the kinds of jobs I’m applying for. I have been learning to write SQL queries in PostgresQL, so that’s the syntax you’ll see.
It’s all well and good doing projects to build my skills to showcase (which can be found on my GitHub here, or through my Data Portfolio page), but I think it would be worth publicizing this more (<- spy the American spelling…)
Online Ticket Sales: A SQL Project
I found a dataset (including seven tables) on Kaggle that would be interesting to analyze, and decided to pretend to be running an online ticket sales company. I did some basic exploratory analysis to get an idea of what was contained within the tables before coming up with five questions to answer.
To explore the data, I simply used:
SELECT *
FROM [table_name]
LIMIT 10;
I then came up with five questions to answer:
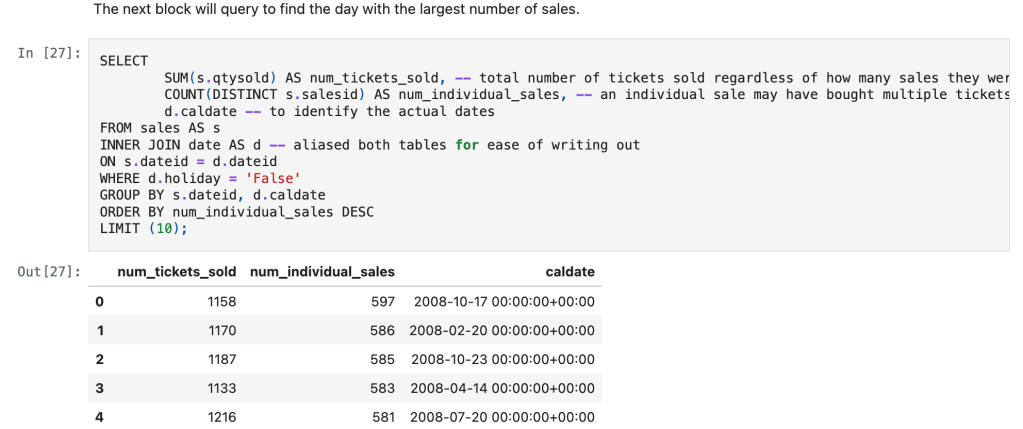
- On which non-holiday day of the year was the number of sales made the highest?
- Which category name (e.g. NHL, pop performances etc) were most popular?
- Which month were the most NFL tickets sold in?
- Which events were the top 10 for ticket revenue in the first quarter of 2008?
- Of the pop artists that performed in October, which one sold the largest number of tickets in total?
What I didn’t notice was, since the dataset was likely computer generated, there were no records relating to 7/11 event types. This meant that Q3 instead was answered about musicals, rather than NFL.
It was important to me to still answer this question (even if it was about a different category) since the main goal of this project was to practice using my querying skills. The query I wrote was:
SELECT
	COUNT(qtysold) AS num_tickets_sold,
	d.month
FROM sales AS s
LEFT JOIN event AS e
ON s.eventid = e.eventid
LEFT JOIN date AS d
ON s.dateid = d.dateid
WHERE catid = 6
GROUP BY d.month
ORDER BY num_tickets_sold DESC;
To see the other queries I wrote, the output from each query and the conclusions I found to each question, see my SQL Project here! The link will take you to the GitHub notebook for this project in my portfolio.
I’m planning to post again soon with more information about the analysis I completed for my EdD using the programming language R – stay tuned!

Leave a reply to Tableau dashboard: car sales in the US – odeneal.blog Cancel reply